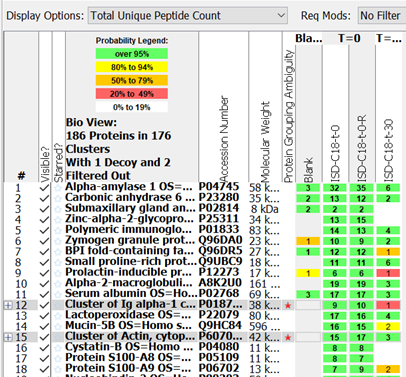
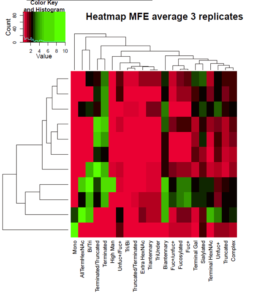
Proteins from different groups of samples are analyzed to find differentially expressed proteins. These experiments are performed on a nanoLC-Orbitrap instrument, which is sensitive and state-of-the art in its high resolution and quality of the MS2 fragmentation spectra. Scaffold Viewer can be provided as software tool for data viewing from a variety of angles. We also work close together with academia, a bioinformatician and data scientist to analyze the data according to your needs. A volcano plot, Venn diagram, box plot, PCA or heatmap are ways to visualize the data. This will be performed according to your needs. Examples are given in the Figure below.